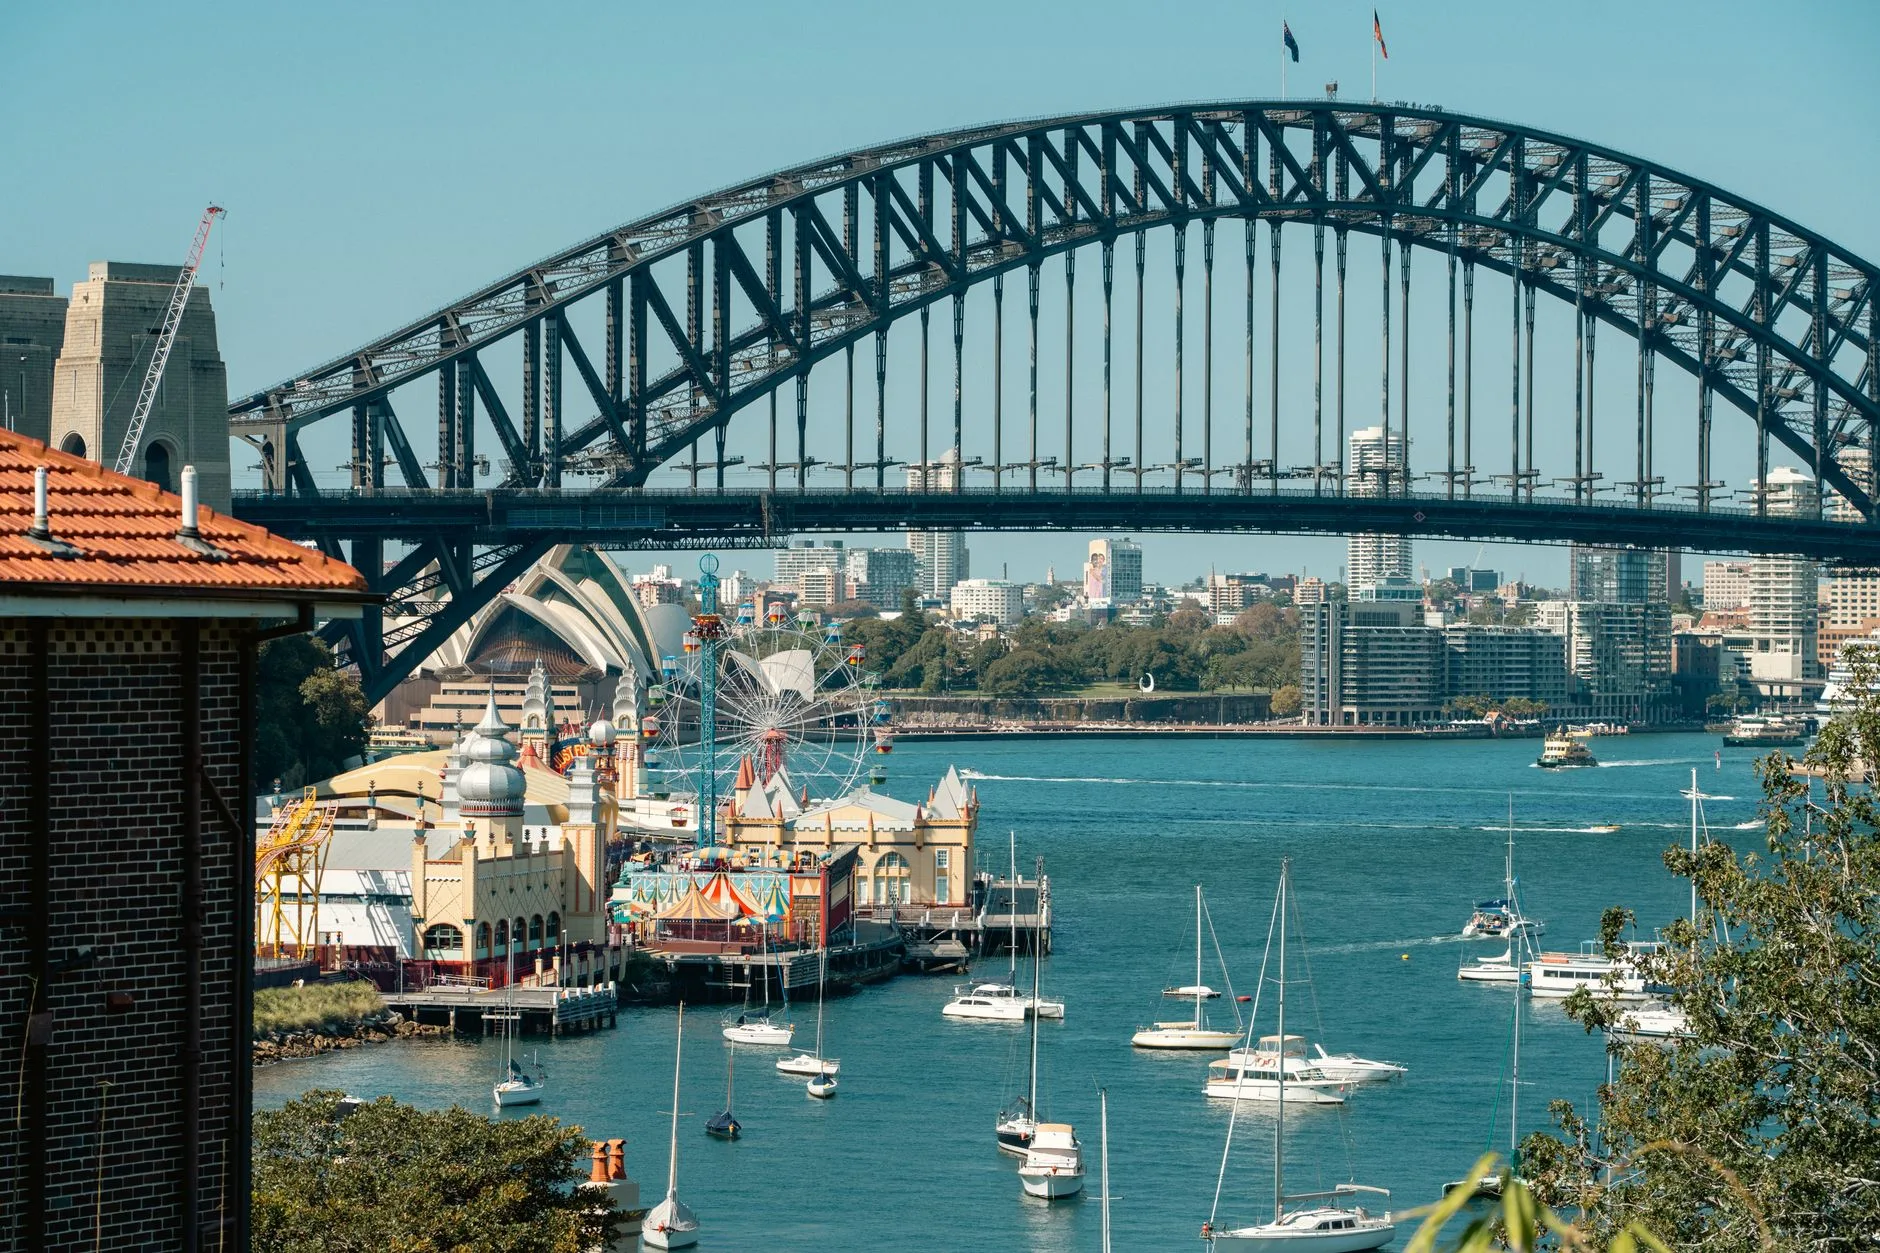
Australia takes fourth place in the WEF index
Australia ranks fourth in the World Economic Forum's Travel and Tourism Development Index 2026. The country scores 5.18 on the index's one-to-seven scale, two places higher than the 2024 edition and 3.5 per cent above its recalculated 2024 score.
The World Economic Forum published the index with Zurich Insurance Group. It scores 110 economies across 17 pillars held in five dimensions: the enabling environment, travel and tourism policy and enabling conditions, infrastructure and services, travel and tourism resources, and travel and tourism sustainability.
Japan leads on 5.27. The United States follows on 5.23, Spain on 5.22 and Australia on 5.18. France completes the first five on 5.17. Advanced economies hold nine of the top ten positions with China the sole exception, and European economies hold six places in the top ten.
Australia's own scorecard
The index's Australia factsheet credits exceptional natural attractions, a skilled workforce and a strong business environment. The same factsheet names high travel costs, its rankings for safety and security, and limited government prioritisation of tourism among the constraints on the score.
Asia-Pacific leads the improvement
Asia-Pacific was the most improved region, with its average score up 3.6 per cent between 2024 and 2026. The Middle East and North Africa gained 2.5 per cent, Europe and Eurasia 1.8 per cent and the Americas 1.6 per cent. Sub-Saharan Africa recorded the smallest gain at 1.1 per cent.
Across all 110 economies, 101 improved their score and the average rose 2.1 per cent. Albania recorded the largest gain of any economy with a 7.0 per cent rise. Japan and Australia improved faster than the index average.
Price competitiveness fell 3.1 per cent globally
The index's own pillar table puts the global average for Price Competitiveness down 3.1 per cent between the two editions, with 75 per cent of ranked economies recording lower scores. The report calls Price Competitiveness one of the lowest-performing pillars of the period.
The report attributes the decline to fuel, labour, accommodation and food costs that outran inflation in many destinations. Gasoline prices rose in about 65 per cent of the ranked economies after 2024. Mid-class and above hotel room prices increased by an average of 6 per cent across the ranked economies.
T&T Socioeconomic Impact records the steepest decline of the 17 pillars in the same table, down 3.5 per cent with 17 per cent of economies improving. The report links the fall to crowding and visitor concentration above pre-pandemic levels.
The investment gap and the value argument
Investment has not kept pace with demand. The report cites WTTC analysis of G20 economies showing capital investment in travel and tourism lagging activity since 2022, with the investment gap expected to persist until 2033. By 2035 the sector could face a shortfall of 43 million workers, 16 per cent below required levels.
The report's third priority for destination managers is competing on value through service quality, trusted experiences and long-term investment. It recommends supporting higher-value segments that carry business, events and year-round travel, and adapting offers to tighter budgets without eroding quality.
The report's Costa Rica case study prices the approach. Costa Rica ranks 86th on Price Competitiveness and fourth on the sustainability dimension. International arrivals grew by about 1 per cent in 2025, while average visitor spending rose to about $1,848 per trip from $1,602, a gain of around 15 per cent.
Demand has kept growing through the cost pressure. International arrivals reached a record 1.5 billion in 2025, up 5 per cent on 2024 and 4.4 per cent above 2019, on the UN Tourism figures the report cites. Travel and tourism contributed $11.6 trillion in 2025 including indirect and induced effects, up 4.1 per cent on the year and 8.7 per cent on 2019, and supported 366 million jobs. Domestic travel carried 73.6 per cent of traveller spending at $5.6 trillion, up 3.7 per cent. Business travel reached $1.5 trillion, up 4 per cent.
What the cost pressure means for a day room
A daytime or hourly booking sells part of a room-day whose payroll, utilities and administrative cost are committed first. The day rate has to clear that committed cost before it contributes anything to the property.
The index gives the day-use seller no rate to work from. It publishes no occupancy, average daily rate or revenue per available room for any economy, no property-level performance and no hotel pipeline figure.
Dayuse lists 296 day hotels across Australia, with day rates on its first page from US$55.56 to US$195.86.
An operator pricing a day slot against a 6 per cent rise in the overnight rate card can hold the slot at its share of the committed room-day cost. Price the slot from the committed cost base first, then compare it with the overnight rate the same room commands.